|
This webpage demonstrates
the rate that noise decreases as we increase the number averaged images
in a stack. The math says that we get a 1.41 (the square root of two)
increase in signal to noise ratio when we double the number of subframes.
The below table shows a remarkably close correlation to the predicted
S/N improvement.
First, here are some
particulars about the images shown below.
-
The images are
composed of 15-minute dithered sub exposures with an STF–8300
camera.
-
All processing is with
CCDStack and exported as TIF for PhotoShop cropping.
-
Except for the last
four images, there is no data rejection.
-
To show the noise better, the images
are displayed double size.
-
Quad = Quadratic B-Spline
registration.
-
NN = Nearest Neighbor
registration.
-
The two data rejection
methods are…
Std Sigma Reject with the factor of two.
Minimum/Maximum rejection of 2/2.
-
The images do not
reflect the data shown in the below table. The signal-to-noise
ratios were taken from another background area with, no stars. The
FWHM data were taken from a much larger area, with no saturated
stars.
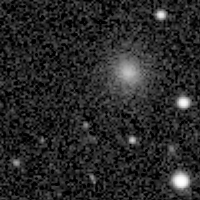
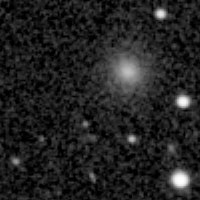
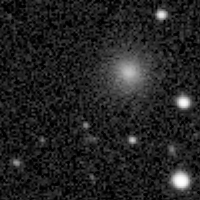
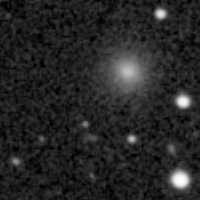
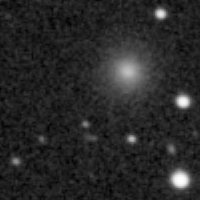
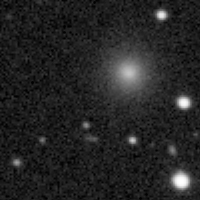
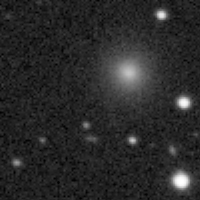
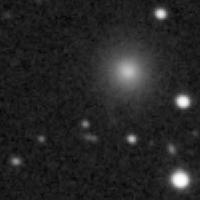
The images and data
clearly show the benefits of increasing the sub exposure count and the
plus and minuses of using nearest neighbor registration, versus a
routine such as Quadratic B-Spline. The nearest neighbor registration
gives about a 5% improvement in FWHM. However, this comes at a cost of a
lower signal-to-noise ratio. When imaging a globular cluster, this 5%
increase can be noticeable. The Quadratic B-Spline registration does a
better job of showing very faint background galaxies. This is evidenced
by two faint galaxies at the upper left corner of the images.
In this test, the Min/Max rejection gives better results than the
Std Sigma rejection. The difference is not strongly evident in the shown
images. Other areas, of the uncropped image, show strong differences in
rejected hot and cold pixels. The Sigma rejection used a factor of 2.0.
Other factors may give a better result than the Min/Max rejection. This
may simply highlight the author's lack of knowledge in using CCDStack. |