|
|
Click the image for a larger view.
(2400 x 1800 - 1.64 MB)

Click the image for a larger view.
(2400 x 1800 - 1.51 MB)

Click the image for a larger view.
(2400 x 1800 - 1.57 MB)
|
Instrument |
Takahashi FSQ-106ED @
f/5.0 (530 mm F.L.) Captured at 2.1 arcsec/pixel. Shown at
2.90 and 9.28 arcsec/pixel. |
|
Mount |
Losmandy G11 with Gemini L4 v1.0 |
|
Camera |
SBIG STF-8300M Self
Guiding Package w/ mono ST-i, using AstroDon 5nm SII, Ha and OIII filters. |
|
Acquisition Data |
9/28/2013 to 1/6/2014 Chino Valley, AZ... with CCDAutoPilot5 & CCDSoft. |
|
Exposure |
|
SII |
660
min. (44 x 15 min. bin 1x1) |
|
Ha |
195 min. (13 x
15 min. each bin 1x1) |
|
OIII
|
570 min. (38 x 15 min. each bin 1x1)
|
|
|
Software & Processing Notes |
-
CCDSoft, CCDStack, PixInsight
and Photoshop CS6.
-
CCDStack to
calibrate, register, normalize, data reject, combine the sub
exposures.
-
PixInsight for
the initial non-linear stretching.
-
PhotoShop for the
LRGB combine & final touch-up.
-
Noiseware 5, a
PhotoShop plug-in.
-
Click here
for the LRGB image
Click here for the Ha image
|
|
Comment |
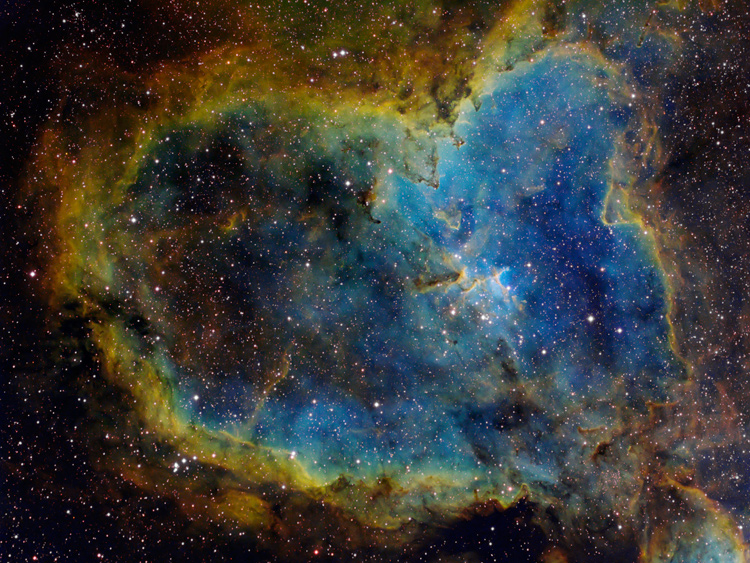
The nebula is shown
rotated 90 degrees clockwise.
The colors in the top
image follow the spirit of the Hubble Palette. The SII data are
mapped to the red channel, the Ha to the green and the 0II data are
mapped to the blue channel. The image was processed to show the
dominance of hydrogen (green) in the area.
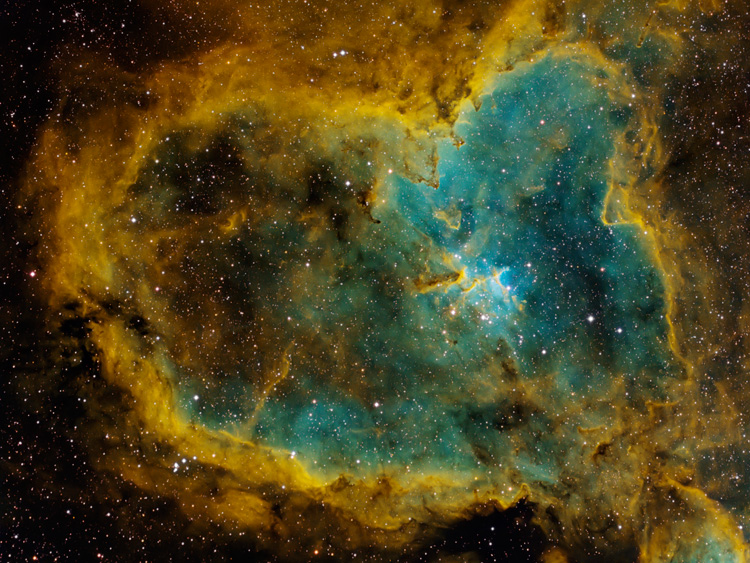
The second image uses the same color palette. In this case, the
three color channels were stretched to similar levels. This more
clearly shows the areas for the three elements.
The third image also uses Hubble Palette color mapping. However, in
this case, the image was processed to show the popular gold and
turquoise motif.
Sprawling across hundreds of light-years, emission nebula IC 1805 is
a mix of glowing interstellar gas and dark dust clouds. Only about
7,500 light-years away, stars were born in this region, nicknamed
the Heart Nebula. Light from this and other glowing gas clouds
surrounding hot, young stars comes in very narrow bands of emission
characteristic of energized atoms within the clouds. The top image
shows the light from sulfur atoms in red hues, with hydrogen in
green, and oxygen atoms in blue.
Source:
NASA APOD |
|