|
Instrument |
Takahashi FSQ-106ED @
f/5.0 (530 mm F.L.) Captured at 2.1 arcsec/pixel. Shown at 4.40 and
9.38 arcsec/pixel. |
|
Mount |
Losmandy G11 with Gemini L4 v1.0 |
|
Camera |
SBIG STF-8300M Self
Guiding Package w/ mono ST-i, using AstroDon 5nm Ha & SII filters
and a 3nm OIII filter. |
|
Acquisition Data |
Taken 10/2/2014 to
10/22/2014 Chino Valley, AZ. with CCDSoft and CCD Commander |
|
Exposure |
|
SII
|
540
min. (36 x 15 min. bin 1x1) |
|
Ha |
390 min. (26 x
15 min. bin 1x1) |
|
OIII
|
420 min. (28 x
15 min. each bin 1x1) |
Click
here for the RGB color image.
Click
here for an Ha filtered b/w image. |
|
Software & Processing Notes |
-
CCDSoft, CCDStack,
PixInsight & Photoshop CS6.
-
CCDStack to
calibrate all sub exposures.
-
PixInsight
processing includes registering, stacking, RGB creation, non-linear stretching with HistogramTransformation
and LocalHistogramEqualization.
-
PhotoShop for
the final touch up.
-
Noiseware 5, a
PhotoShop plug-in.
|
|
Comment |
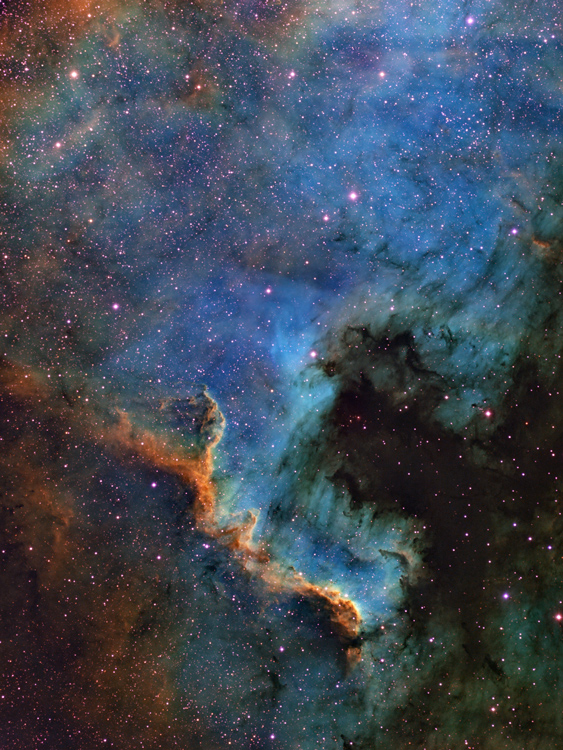
North is to the
top.
The North America
Nebula in the sky can do what most North Americans on Earth cannot
-- form stars. Specifically, in analogy to the Earth-confined
continent, the bright part that appears as Central America and
Mexico is actually a hot bed of gas, dust, and newly formed stars
known as the Cygnus Wall. This skyscape shows the star
forming wall lit and eroded by bright young stars, and partly hidden
by the dark dust they have created. The North America Nebula (NGC
7000) spans about 50 light years and lies about 1,500 light years
away toward the constellation of the Swan (Cygnus).
Source:
NASA APOD
The SII data are mapped to the red channel, the Ha to the green and
the 0III data are mapped to the blue channel. The field is strongly
dominated by the hydrogen. The hydrogen intensity, the green
channel, was reduced by 50%. This allows visibility of the sulfur
and oxygen areas and produces a much more pleasing color balance. |