Focal Pointe Observatory
Astrophotography by Bob Franke

Home
Recent Images
Galaxies
Nebulae
   Natural Color
   Narrow Band
   H-Alpha
Clusters
Comets
Solar System
Observatory
Equipment
Tips & Tricks
Published Images
My Freeware
Local Weather
Terrestrial


Send Email


Sh2-199 - The Soul Nebula

Color Mapped Narrow Band

*/
      Click the full screen zoom button           ^
     
Click the image to Zoom and Pan              

Click here to view the image without Zoomify (1676 x 1266, 928 KB)


*/
      Click the full screen zoom button           ^
     
Click the image to Zoom and Pan              

Click here to view the image without Zoomify (1676 x 1266, 952 KB)


Instrument

Takahashi FSQ-106ED @ f/5.0 (530 mm F.L.) Captured at 2.1 arcsec/pixel.  The Zoomify image scale is 4.2 to 7.44 arcsec / pixel.

Mount

Losmandy G11 with Gemini L4 v1.0

Camera

SBIG STF-8300M Self Guiding Package w/ mono ST-i, using Astrodon filters.

Acquisition Data

11/13/2012 to 1/5/2013 Chino Valley, AZ... with CCDAutoPilot5 & CCDSoft.  Off-axis guided.

Exposure

SII

330 min. (22 x 15 min. bin 1x1)

Hα 

330 min. (22 x 15 min. bin 1x1)

 OIII 495 min. (33 x 15 min. bin 1x1)
 Lum 200 min. (40 x 5 min. bin 1x1)

Red

 90 min. ( 9 x 10 min. each bin 1x1)

Green

120 min. (12 x 10 min. bin 1x1)

 Blue 160 min. (16 x 10 min. bin 1x1)

Click here for the RGB color image.

Click here for the Ha filtered image.

Software

  • CCDSoft, CCDStack, Photoshop CS6, PixInsight and Noel Carboni's actions.

  • CCDStack to calibrate, register, normalize, data reject, combine the sub exposures.

  • PixInsight for gradient removal and the initial non-linear stretching.

  • PhotoShop for color combine & final touch-up.

  • Noiseware Pro, a PhotoShop plug-in.

Comment

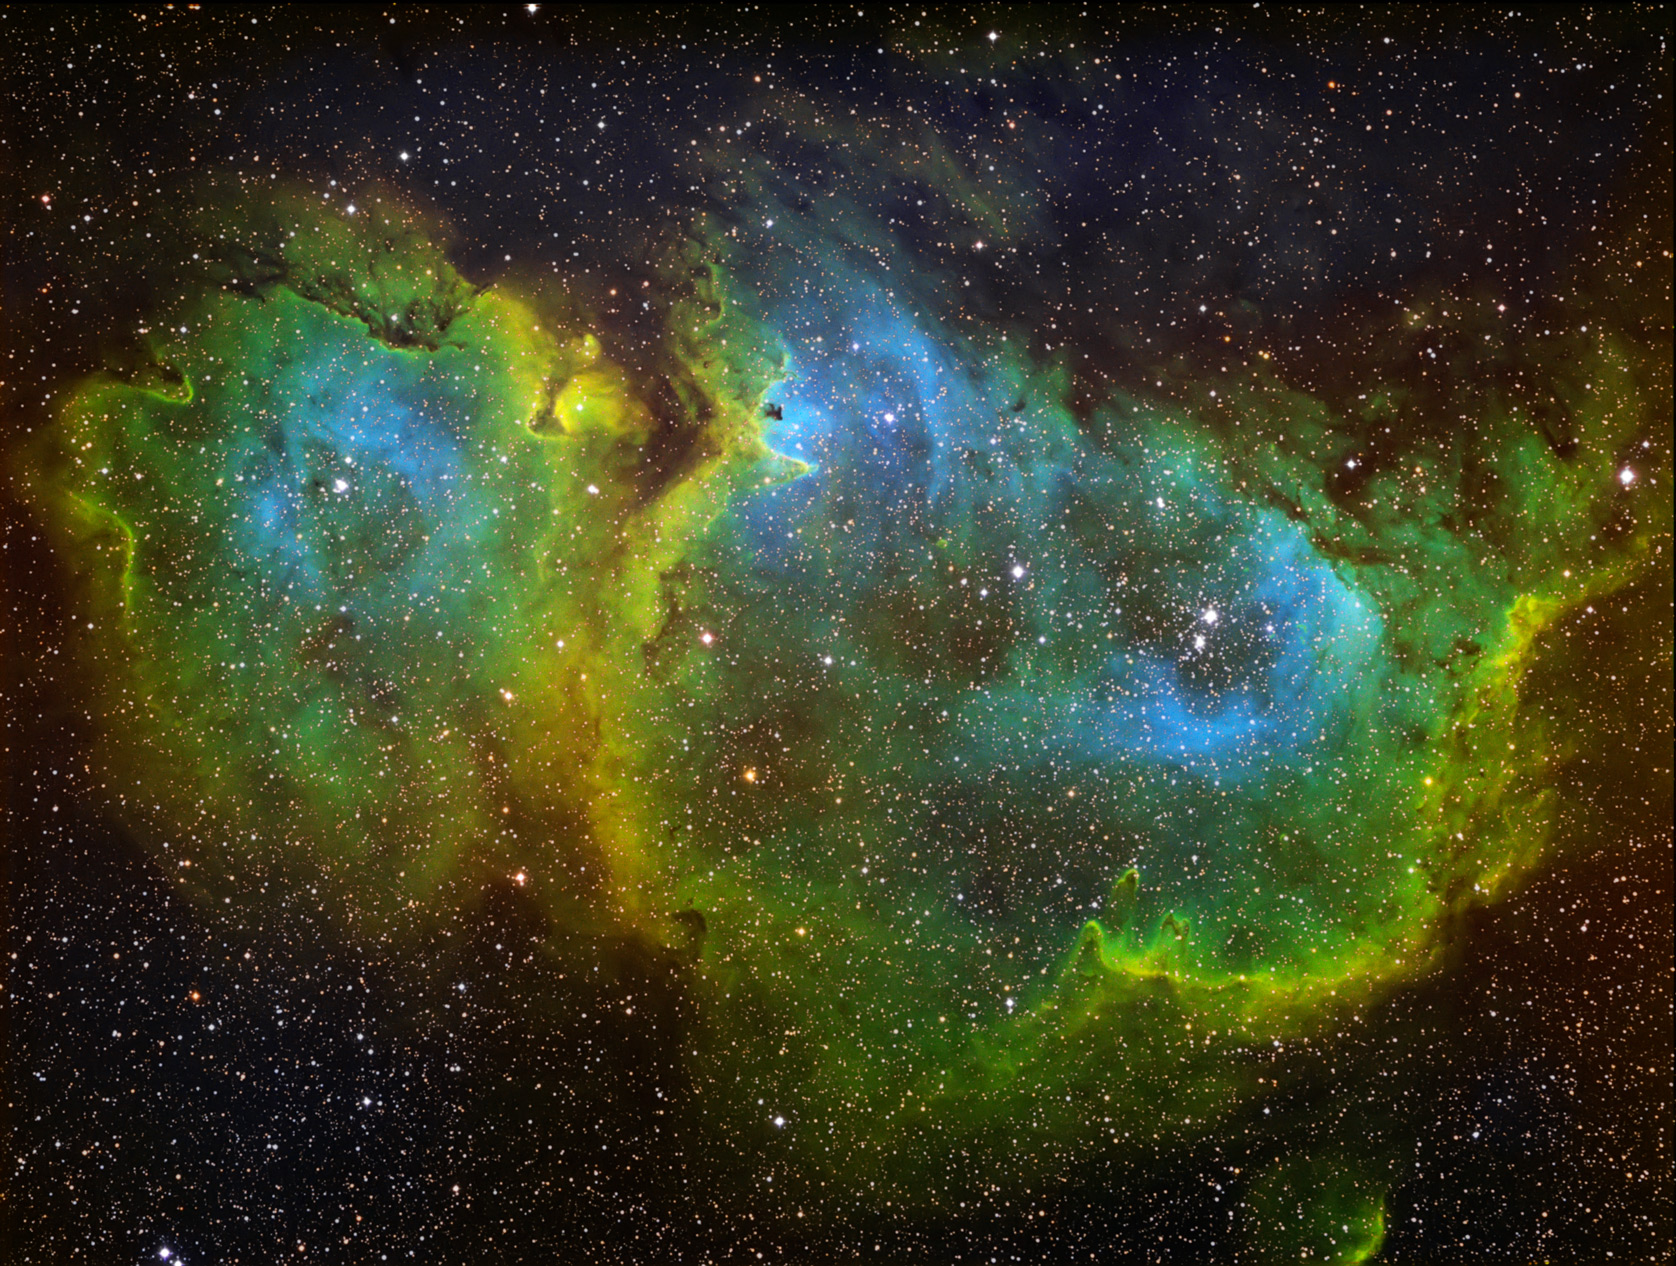
North is to the top.

The soul nebula, (sh2-199, LBN 667) is an emission nebula in the constellation Cassiopeia. The nebula is about 6000 light-years from Earth.
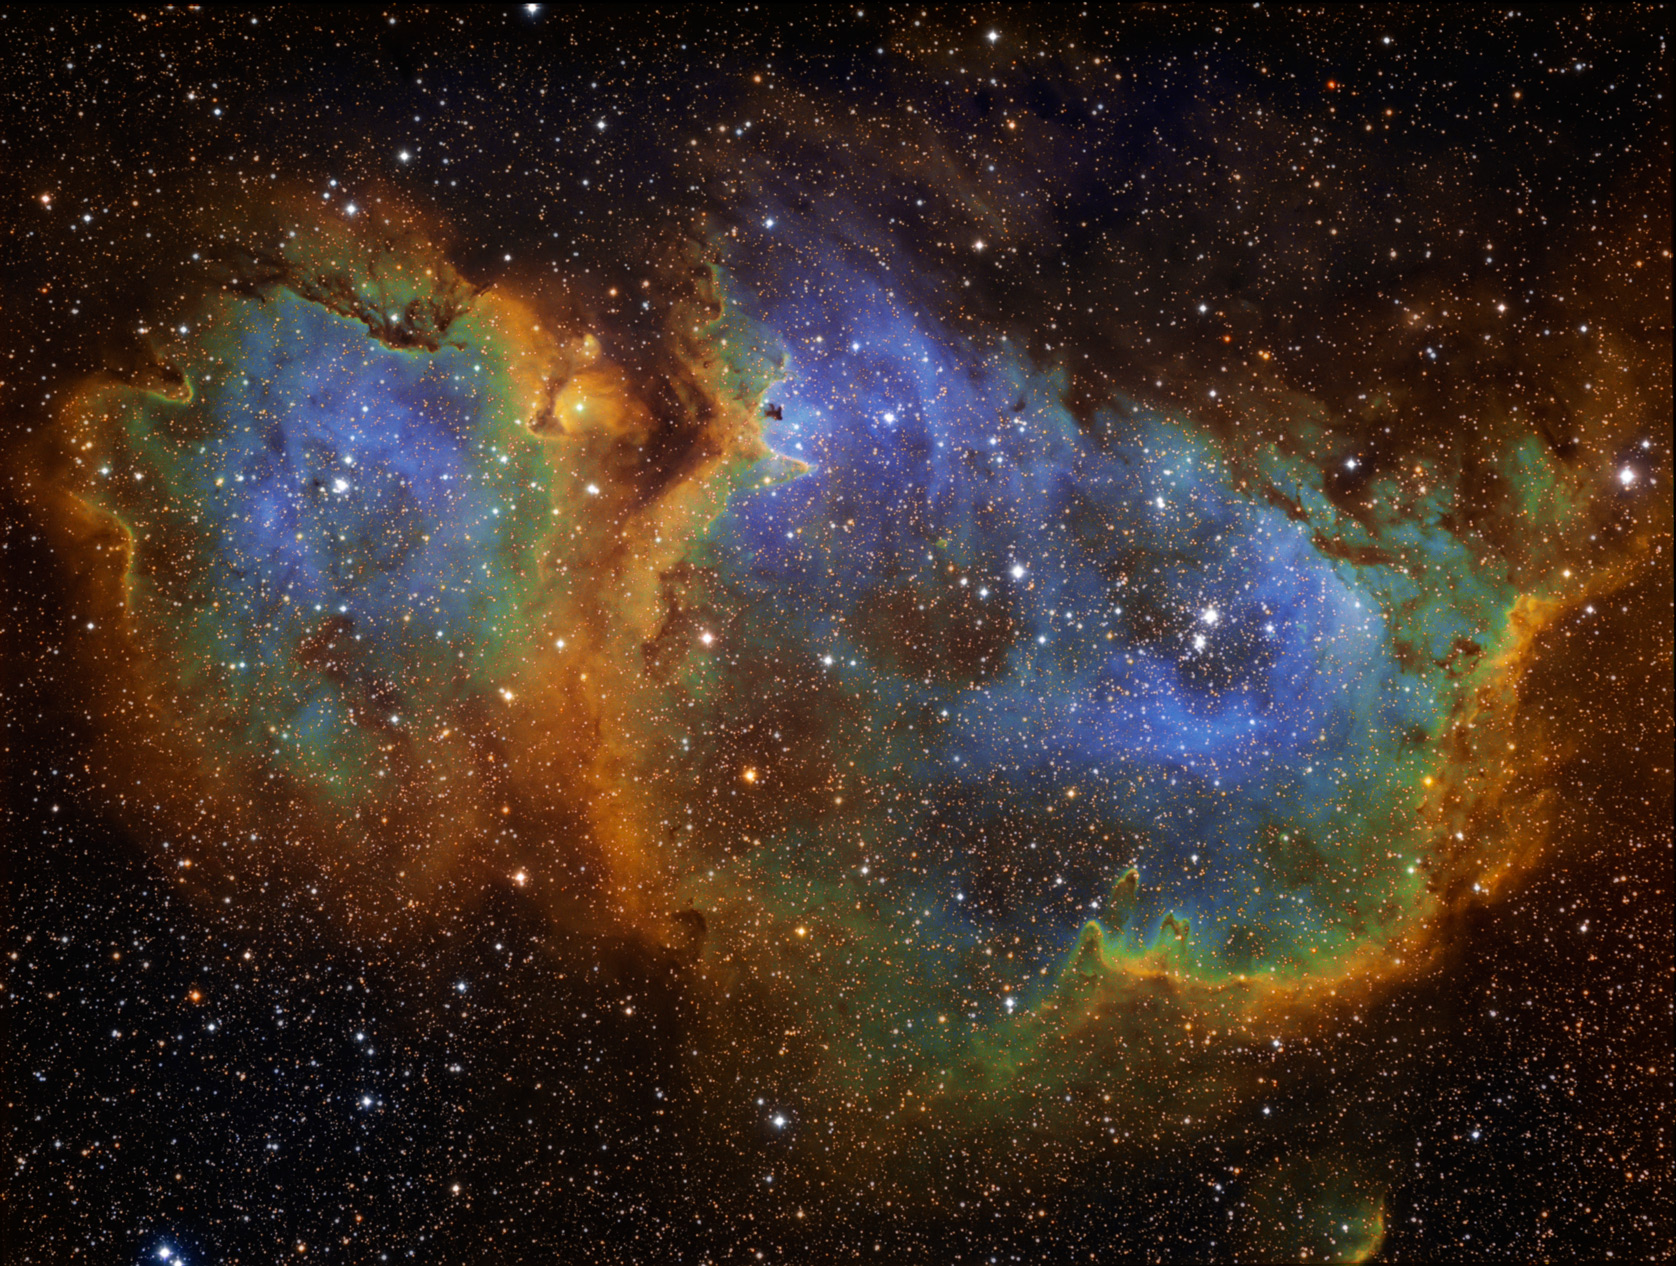
 

Both images were created using the Hubble color palette, with SII, Ha and OIII data mapped to red, green and blue respectively. In the top image, the color channels were adjusted so the hydrogen (green), sulfur (red) and oxygen (blue) areas are easily identified. The bottom image uses the same filter mapping with adjustments to the channel levels to create the popular turquoise and gold motif.


The top image only uses SII, Ha and OIII data. The bottom image has added red, green and blue.